Numeric Response
|
|
|
1.
|
 (Answer is a two digit whole
number.)
|
|
|
2.
|
Yesterday it was 60 degrees. Today it is 75 degrees. How much warmer
is it today than it was yesterday? Express your answer a percentage.
|
|
|
3.
|
 = ? (Answer is a one digit whole
number.)
|
|
|
4.
|
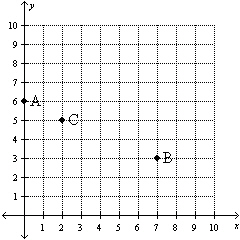 In the graph, what is the x-coordinate
of point C? (Answer is a one digit whole number.)
|
|
|
5.
|
 Draw a line through points A and
D. What is the absolute value of the slope of the line? (Answer is a one digit whole
number.)
|
|
|
6.
|
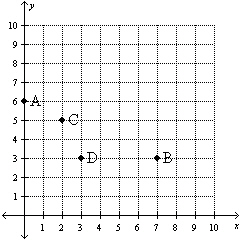 Draw a line through points A and
D. What is the x-intercept of the line? (Answer is a one digit whole number.)
|
|
|
7.
|
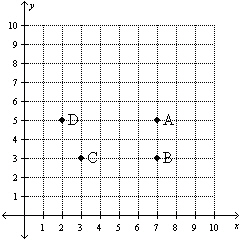 Draw a quadrilateral connecting points
A, B, C, and D. What is its area? (Answer is a one digit whole number.)
|
|
|
8.
|
 What is the value of x? (Answer is a
single digit whole number.)
|
|
|
9.
|
 What is the value of x? (Answer is a
single digit whole number.)
|
|
|
10.
|
 If x is 3, what is the value of y?
(Answer is a single digit whole number.)
|
|
|
11.
|
 If x is 3 and z is 2, what is the value of
y? (Answer is a two digit whole number.)
|
|
|
12.
|
 Currently this equation expresses y in
terms of x. Rearrange it to express x in terms of y. What is the coefficient on y?
(Answer is a single digit whole number.)
|
|
|
13.
|
 Graph this function in the first
quadrant. What is the y-intercept? (Answer is a two digit whole number.)
|
|
|
14.
|
 Graph this function in the first
quadrant. What is the x-intercept? (Answer is a one digit whole number.)
|
|
|
15.
|
 +4 Graph this function in the first
quadrant. What is the y-intercept? (Answer is a two digit whole number.)
|
|
|
16.
|
 What value of x satisfies both of these
equations? In other words, at what value of x do the two functions intersect? (Answer is
a single digit whole number.)
|
|
|
17.
|
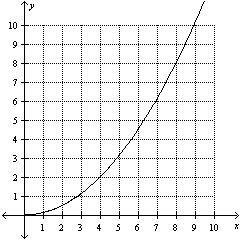
 As x increases from 8 to 9, what is the
approximate increase in y? (Answer is a one digit whole number.)
|
|
|
18.
|
 As x increases from 1 to 2, what is the
approximate increase in y? (Answer is a one digit whole number.)
|
Multiple Choice
Identify the
choice that best completes the statement or answers the question.
|
|
|
19.
|
 This equation describes a a. | point. | c. | set of parabolas. | b. | line. | d. | circle. |
|
|
|
20.
|
 This equation describes a a. | point. | c. | parabola. | b. | line. | d. | circle. |
|
|
|
21.
|
 Connect points A, C and D with a smooth
curve. As you move rightward from A to D, the slope of the curve is a. | getting smaller in absolute value. | c. | staying the
same. | b. | getting bigger in absolute value. | d. | approaching
zero. |
|
|
|
22.
|
 As x increases from zero to 10, the slope
of this function is getting a. | bigger. | c. | staying the same. | b. | smaller. | d. | close to zero. |
|
|
|
23.
|
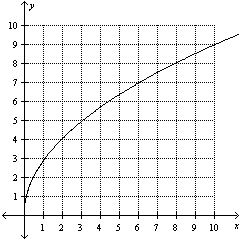 As x increases from zero to 10, the slope
of this function is getting a. | bigger. | c. | staying the same. | b. | smaller. | d. | close to zero. |
|
|
|
24.
|
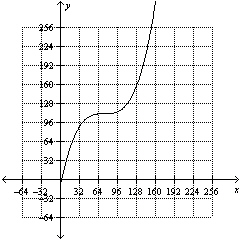 As x increases from zero to 160, the slope
of this function is getting a. | bigger in absolute value. | c. | first bigger then smaller in
absolute value. | b. | smaller in absolute value. | d. | first smaller then bigger in absolute value. |
|